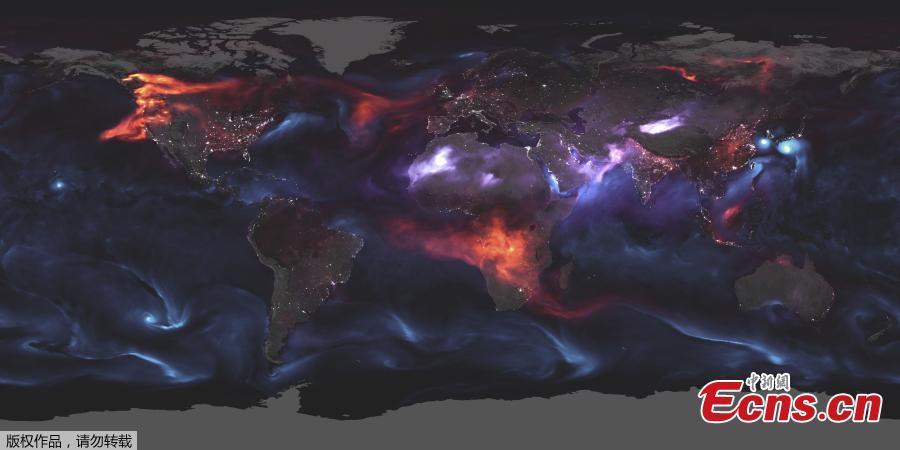
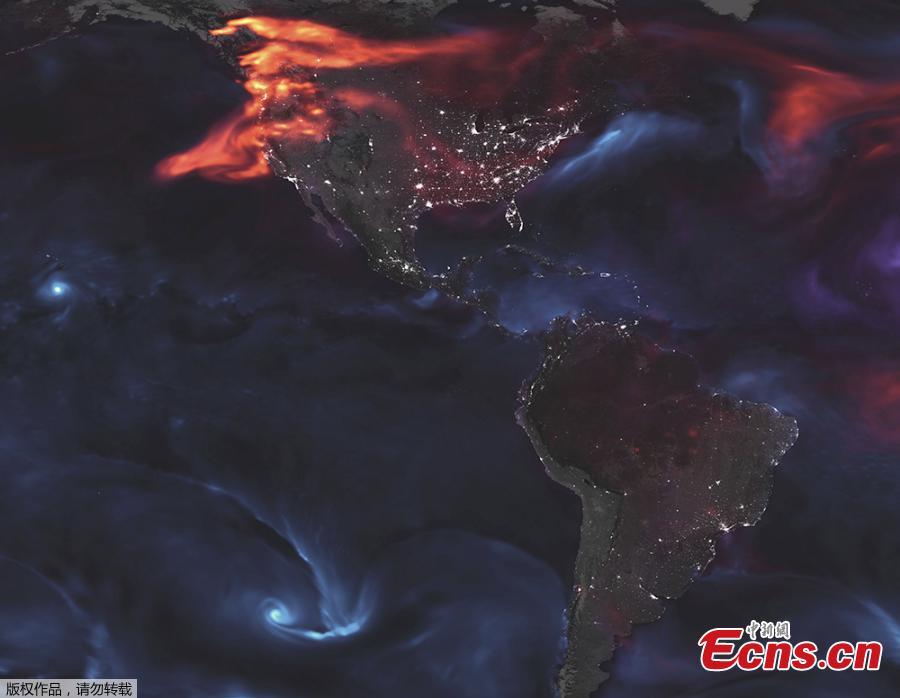
This NASA satellite visualization obtained August 26, 2018, highlights Goddard Earth Observing System Forward Processing (GEOS FP), offering an expansive view of the mishmash of particles that dance and swirl through the atmosphere, of output for aerosols on August 23, 2018. On that day, huge plumes of smoke drifted over North America and Africa, three different tropical cyclones churned in the Pacific Ocean, and large clouds of dust blew over deserts in Africa and Asia. The storms are visible within giant swirls of sea salt aerosol (blue), which winds loft into the air as part of sea spray. Black carbon particles (red) are among the particles emitted by fires; vehicle and factory emissions are another common source. Particles the model classified as dust are shown in purple. The visualization includes a layer of night light data collected by the day-night band of the Visible Infrared Imaging Radiometer Suite (VIIRS) on Suomi NPP that shows the locations of towns and cities. (Photo/Agencies)
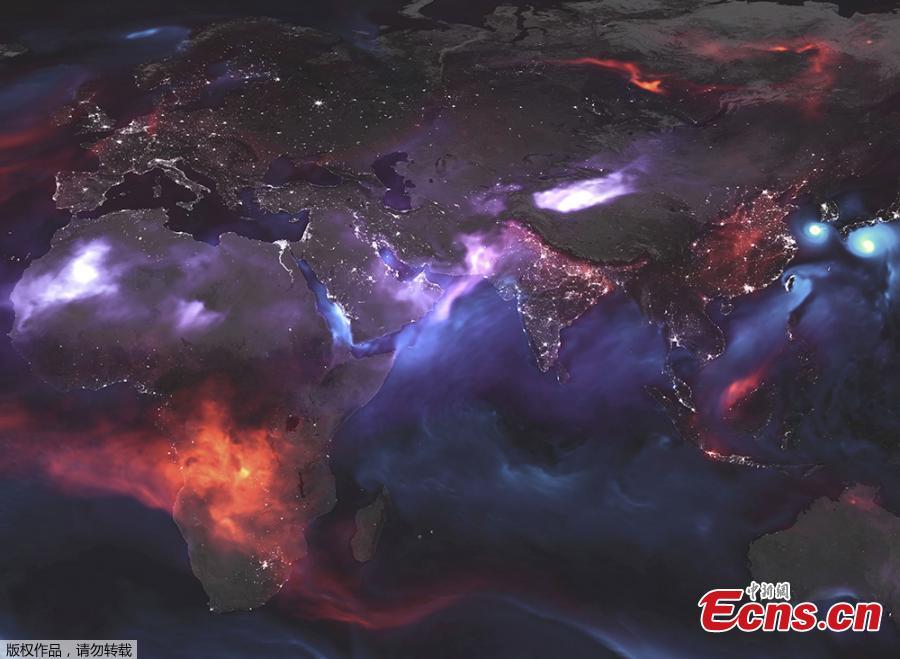
This NASA satellite visualization obtained August 26, 2018, highlights Goddard Earth Observing System Forward Processing (GEOS FP), offering an expansive view of the mishmash of particles that dance and swirl through the atmosphere, of output for aerosols on August 23, 2018. On that day, huge plumes of smoke drifted over North America and Africa, three different tropical cyclones churned in the Pacific Ocean, and large clouds of dust blew over deserts in Africa and Asia. The storms are visible within giant swirls of sea salt aerosol (blue), which winds loft into the air as part of sea spray. Black carbon particles (red) are among the particles emitted by fires; vehicle and factory emissions are another common source. Particles the model classified as dust are shown in purple. The visualization includes a layer of night light data collected by the day-night band of the Visible Infrared Imaging Radiometer Suite (VIIRS) on Suomi NPP that shows the locations of towns and cities. (Photo/Agencies)
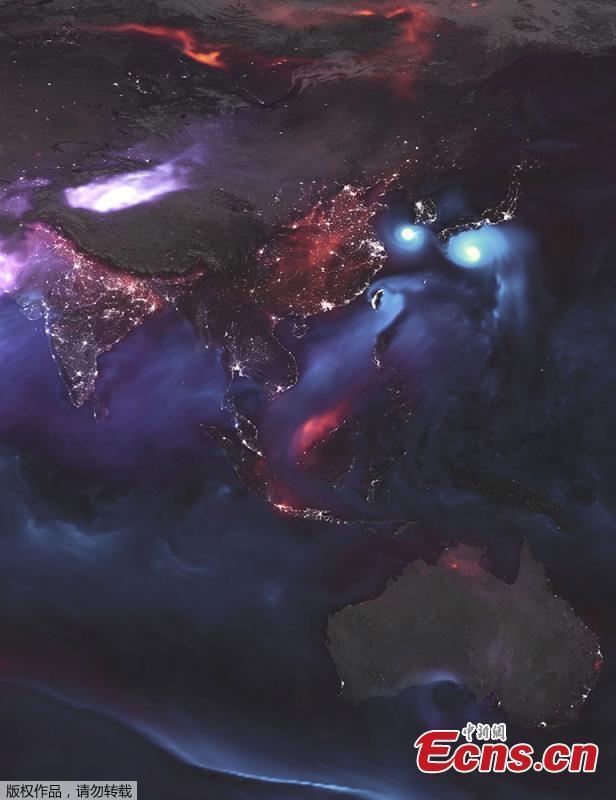
This NASA satellite visualization obtained August 26, 2018, highlights Goddard Earth Observing System Forward Processing (GEOS FP), offering an expansive view of the mishmash of particles that dance and swirl through the atmosphere, of output for aerosols on August 23, 2018. On that day, huge plumes of smoke drifted over North America and Africa, three different tropical cyclones churned in the Pacific Ocean, and large clouds of dust blew over deserts in Africa and Asia. The storms are visible within giant swirls of sea salt aerosol (blue), which winds loft into the air as part of sea spray. Black carbon particles (red) are among the particles emitted by fires; vehicle and factory emissions are another common source. Particles the model classified as dust are shown in purple. The visualization includes a layer of night light data collected by the day-night band of the Visible Infrared Imaging Radiometer Suite (VIIRS) on Suomi NPP that shows the locations of towns and cities. (Photo/Agencies)
This NASA satellite visualization obtained August 26, 2018, highlights Goddard Earth Observing System Forward Processing (GEOS FP), offering an expansive view of the mishmash of particles that dance and swirl through the atmosphere, of output for aerosols on August 23, 2018. On that day, huge plumes of smoke drifted over North America and Africa, three different tropical cyclones churned in the Pacific Ocean, and large clouds of dust blew over deserts in Africa and Asia. The storms are visible within giant swirls of sea salt aerosol (blue), which winds loft into the air as part of sea spray. Black carbon particles (red) are among the particles emitted by fires; vehicle and factory emissions are another common source. Particles the model classified as dust are shown in purple. The visualization includes a layer of night light data collected by the day-night band of the Visible Infrared Imaging Radiometer Suite (VIIRS) on Suomi NPP that shows the locations of towns and cities. (Photo/Agencies)